/consumer-insights/socialSocial
Social Intelligence, the main Consumer Insights screen. Four headline tiles (topic spikes, estimated reach, net sentiment, mentions) sit above four tabs that each answer a different question: Share of Voice (where do we rank), Sentiment (how do people feel), Topics (what spiked and why), Channels (where is it happening).
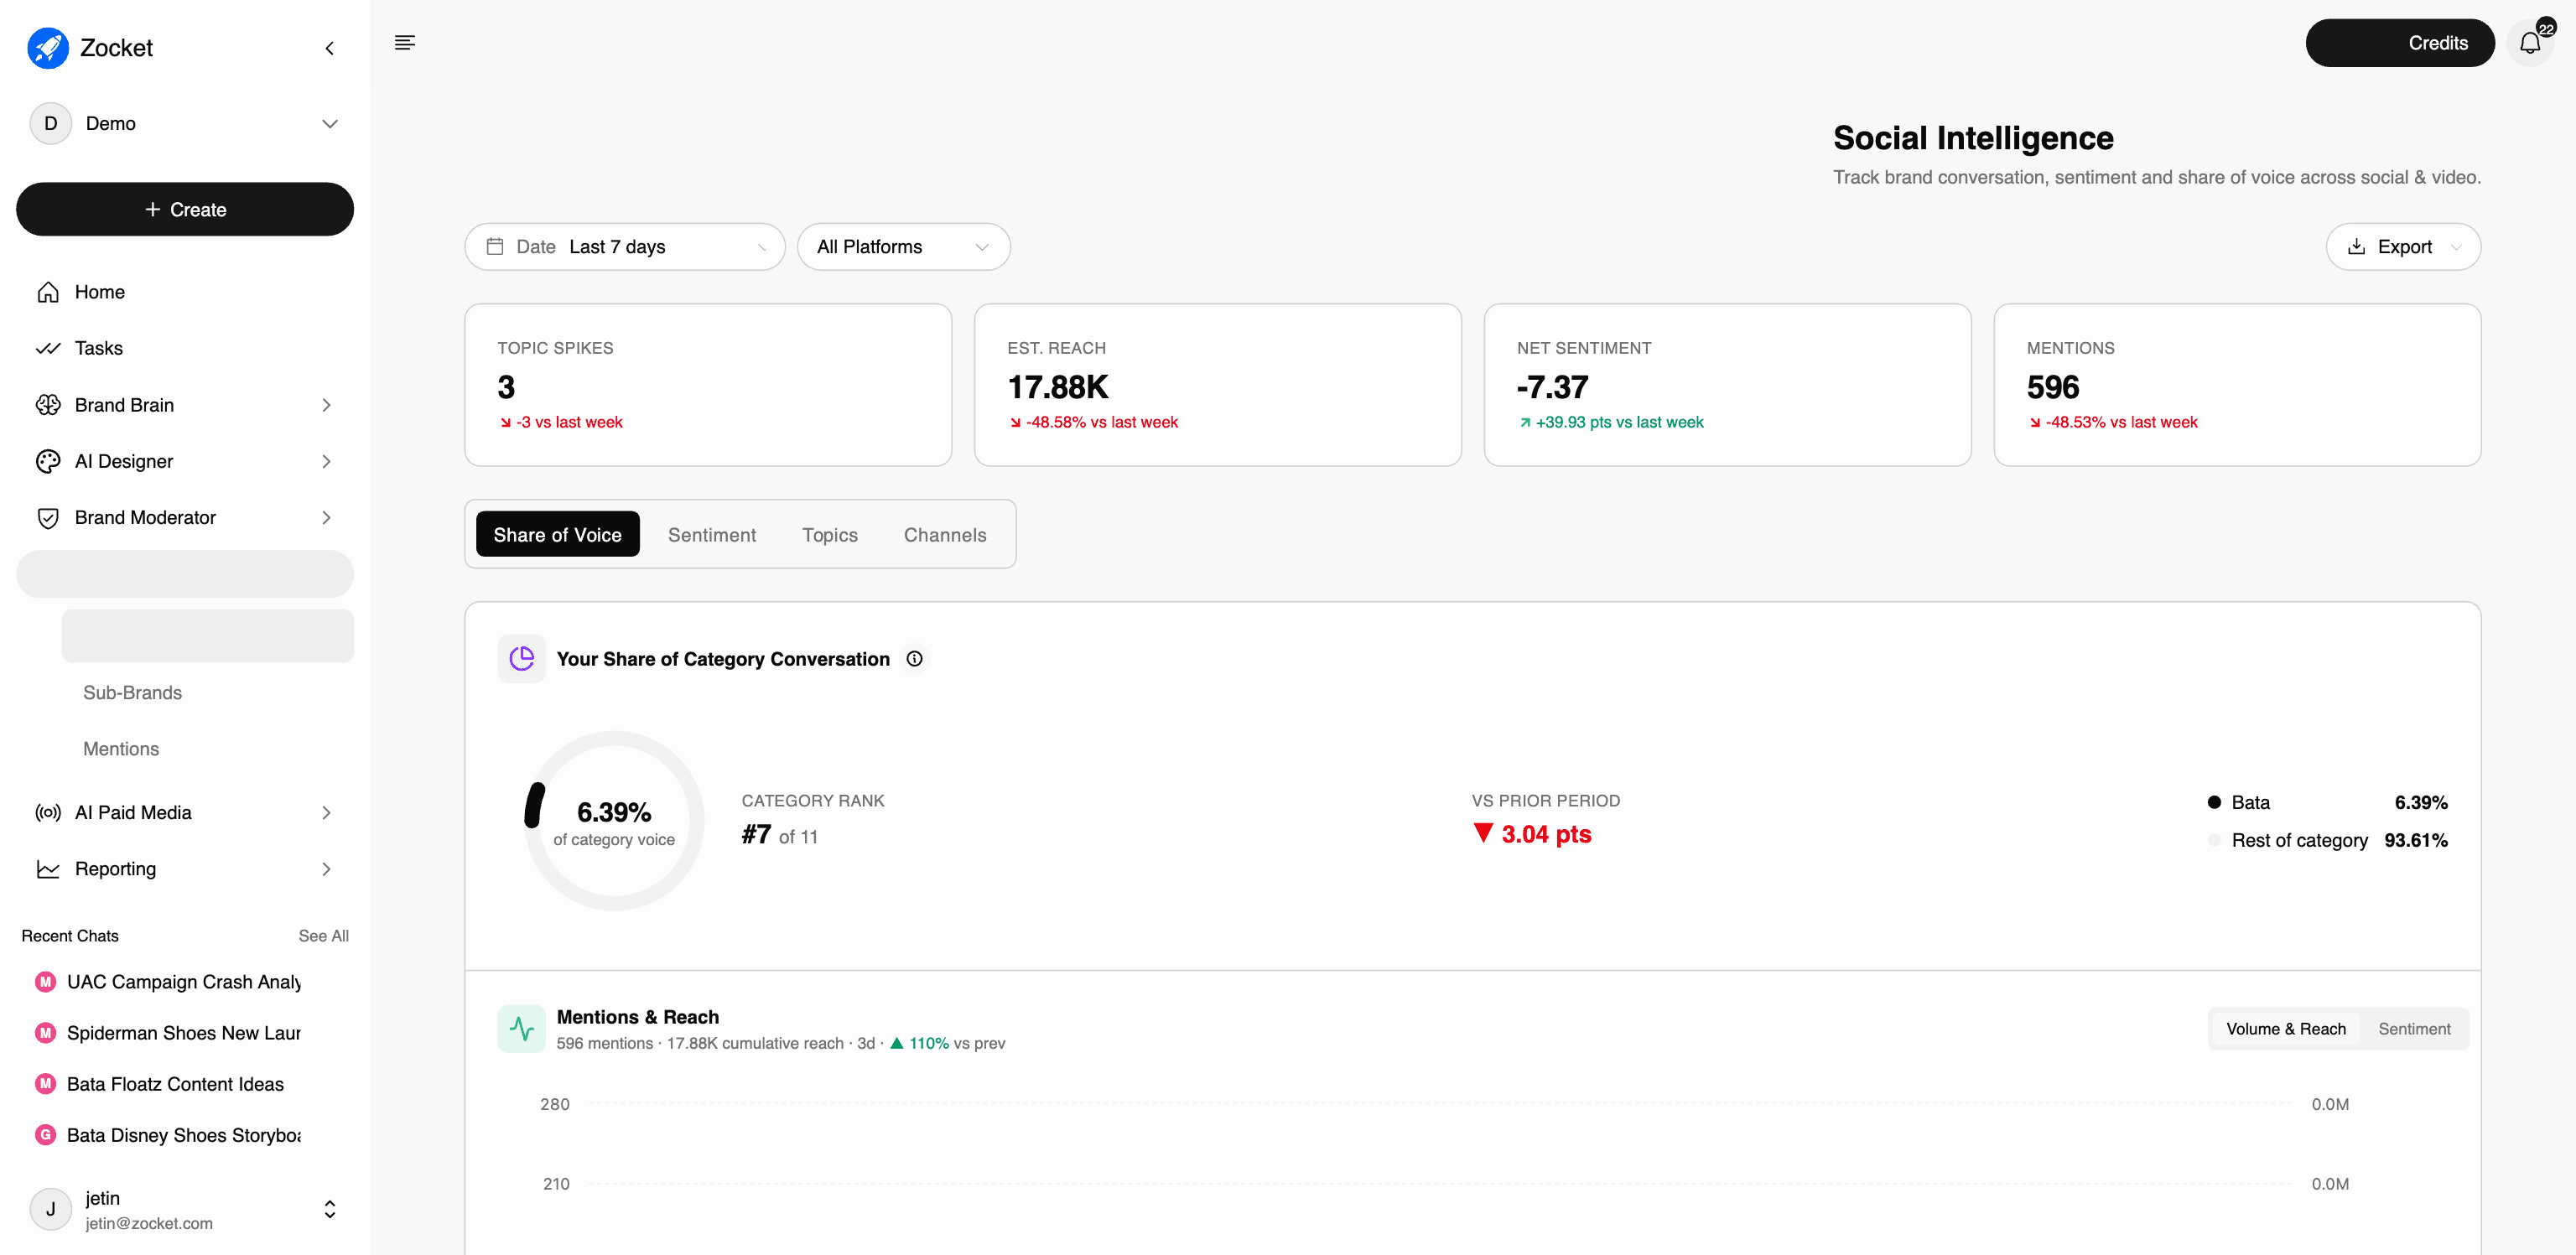
What this does for you: Answers "how is the brand doing in conversation right now", and answers it relative to the category rather than in isolation. This is the screen the CMO's question lands on.
Always on screen: a date range, a platform filter, an Export control, and four headline tiles, each with its own week-on-week movement:
- Topic spikes: how many unusual conversation events fired this period
- Est. reach: how many people the conversation could have touched
- Net sentiment: a single score, positive or negative
- Mentions: raw volume
Below those sit four tabs. They are not four views of the same chart; each answers a different question, and a good demo touches all four.
Share of Voice: where do we rank
- Your share of category conversation as a percentage, with your category rank ("#7 of 11") and the movement versus the prior period
- The split between you and the rest of the category, plus the per-competitor breakdown behind that rank
- Mentions and reach over time, toggleable between volume and sentiment
- The full list of sources the number is computed across, so the figure is auditable rather than asserted
This is the differentiator. Most listening tools report your own mention count. A rank against every tracked competitor is a number a brand lead can take into a review.
Sentiment: how do people feel
- Positive / neutral / negative split across all mentions this period
- An auto-written interpretation when something is off, for example a note that negative share is above the healthy range with a prompt to review the top negative topics
- Sentiment trend over time across all channels
- Sentiment by channel, scored from -100 to +100, which routinely shows one platform dragging the average down while others are healthy
Topics: what spiked and why
- Spike analysis: daily mentions plotted against an expected baseline, with genuine spikes marked
- Each spike is auto-explained, newest first: a named theme, how far above normal it ran (multiple and percentage), and the mentions and reach behind it
This is the tab that turns "something happened last Tuesday" into "the Spider-Man giveaway drove a 3x spike". It is also the input to moment-marketing decisions.
Channels: where is it happening
- Mention growth per platform versus the prior period
- What people discuss per channel, with the top themes and their share, which is usually different per platform (pricing on one, product quality on another, sustainability on LinkedIn)
- Competitor discussion themes with a competitor selector, so you can see what people say about a rival on each channel
- Trending keywords as a cloud sized by frequency and coloured by sentiment, for you and separately for a chosen competitor
How the tabs work together in a demo
Run them in order and they tell one story: we rank #7 of 11 and slipped (Share of Voice), because negative sentiment is concentrated on one channel (Sentiment), driven by a specific spike last week (Topics), and here are the exact themes and words behind it (Channels).
What changed: this screen was called Overview and sat alongside a separate Channels page. Both are folded in here. Consumer Insights is now Social / Sub-Brands / Mentions on the /consumer-insights/* route.
When to come here: Weekly brand health check. Before any leadership or board update. After a campaign lands, to see whether it moved conversation share.
The click-path, step by step
1Social KPIs 
2Insight tabs 
3Share of voice 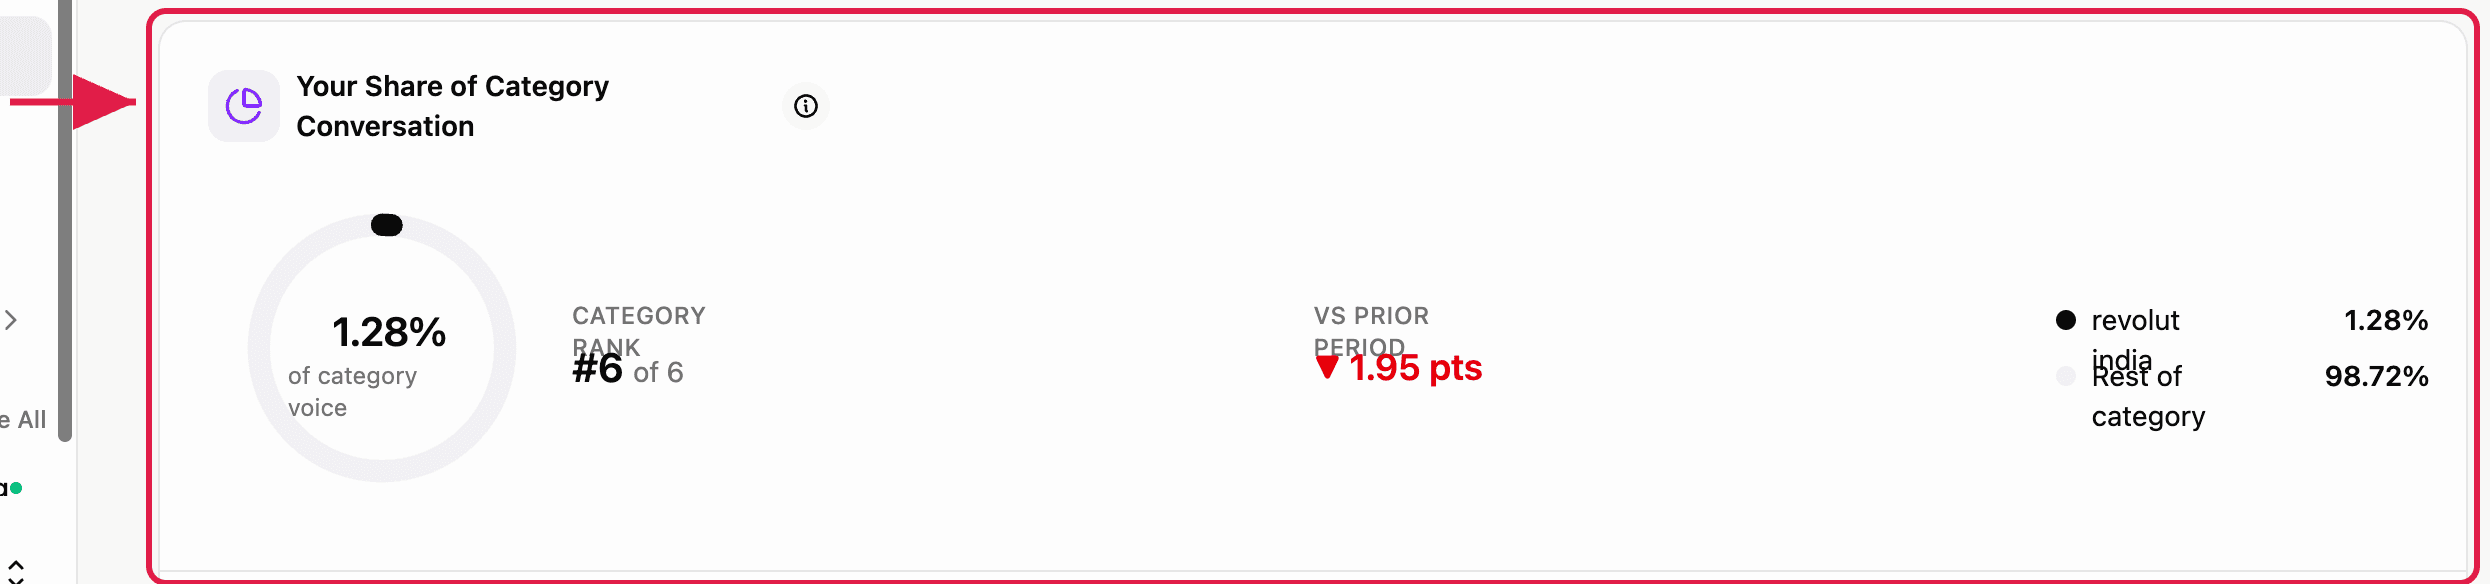
4Sentiment tab: positive / neutral / negative split, an auto-written warning when negative is above the healthy range, sentiment trend, and sentiment scored per channel from -100 to +100 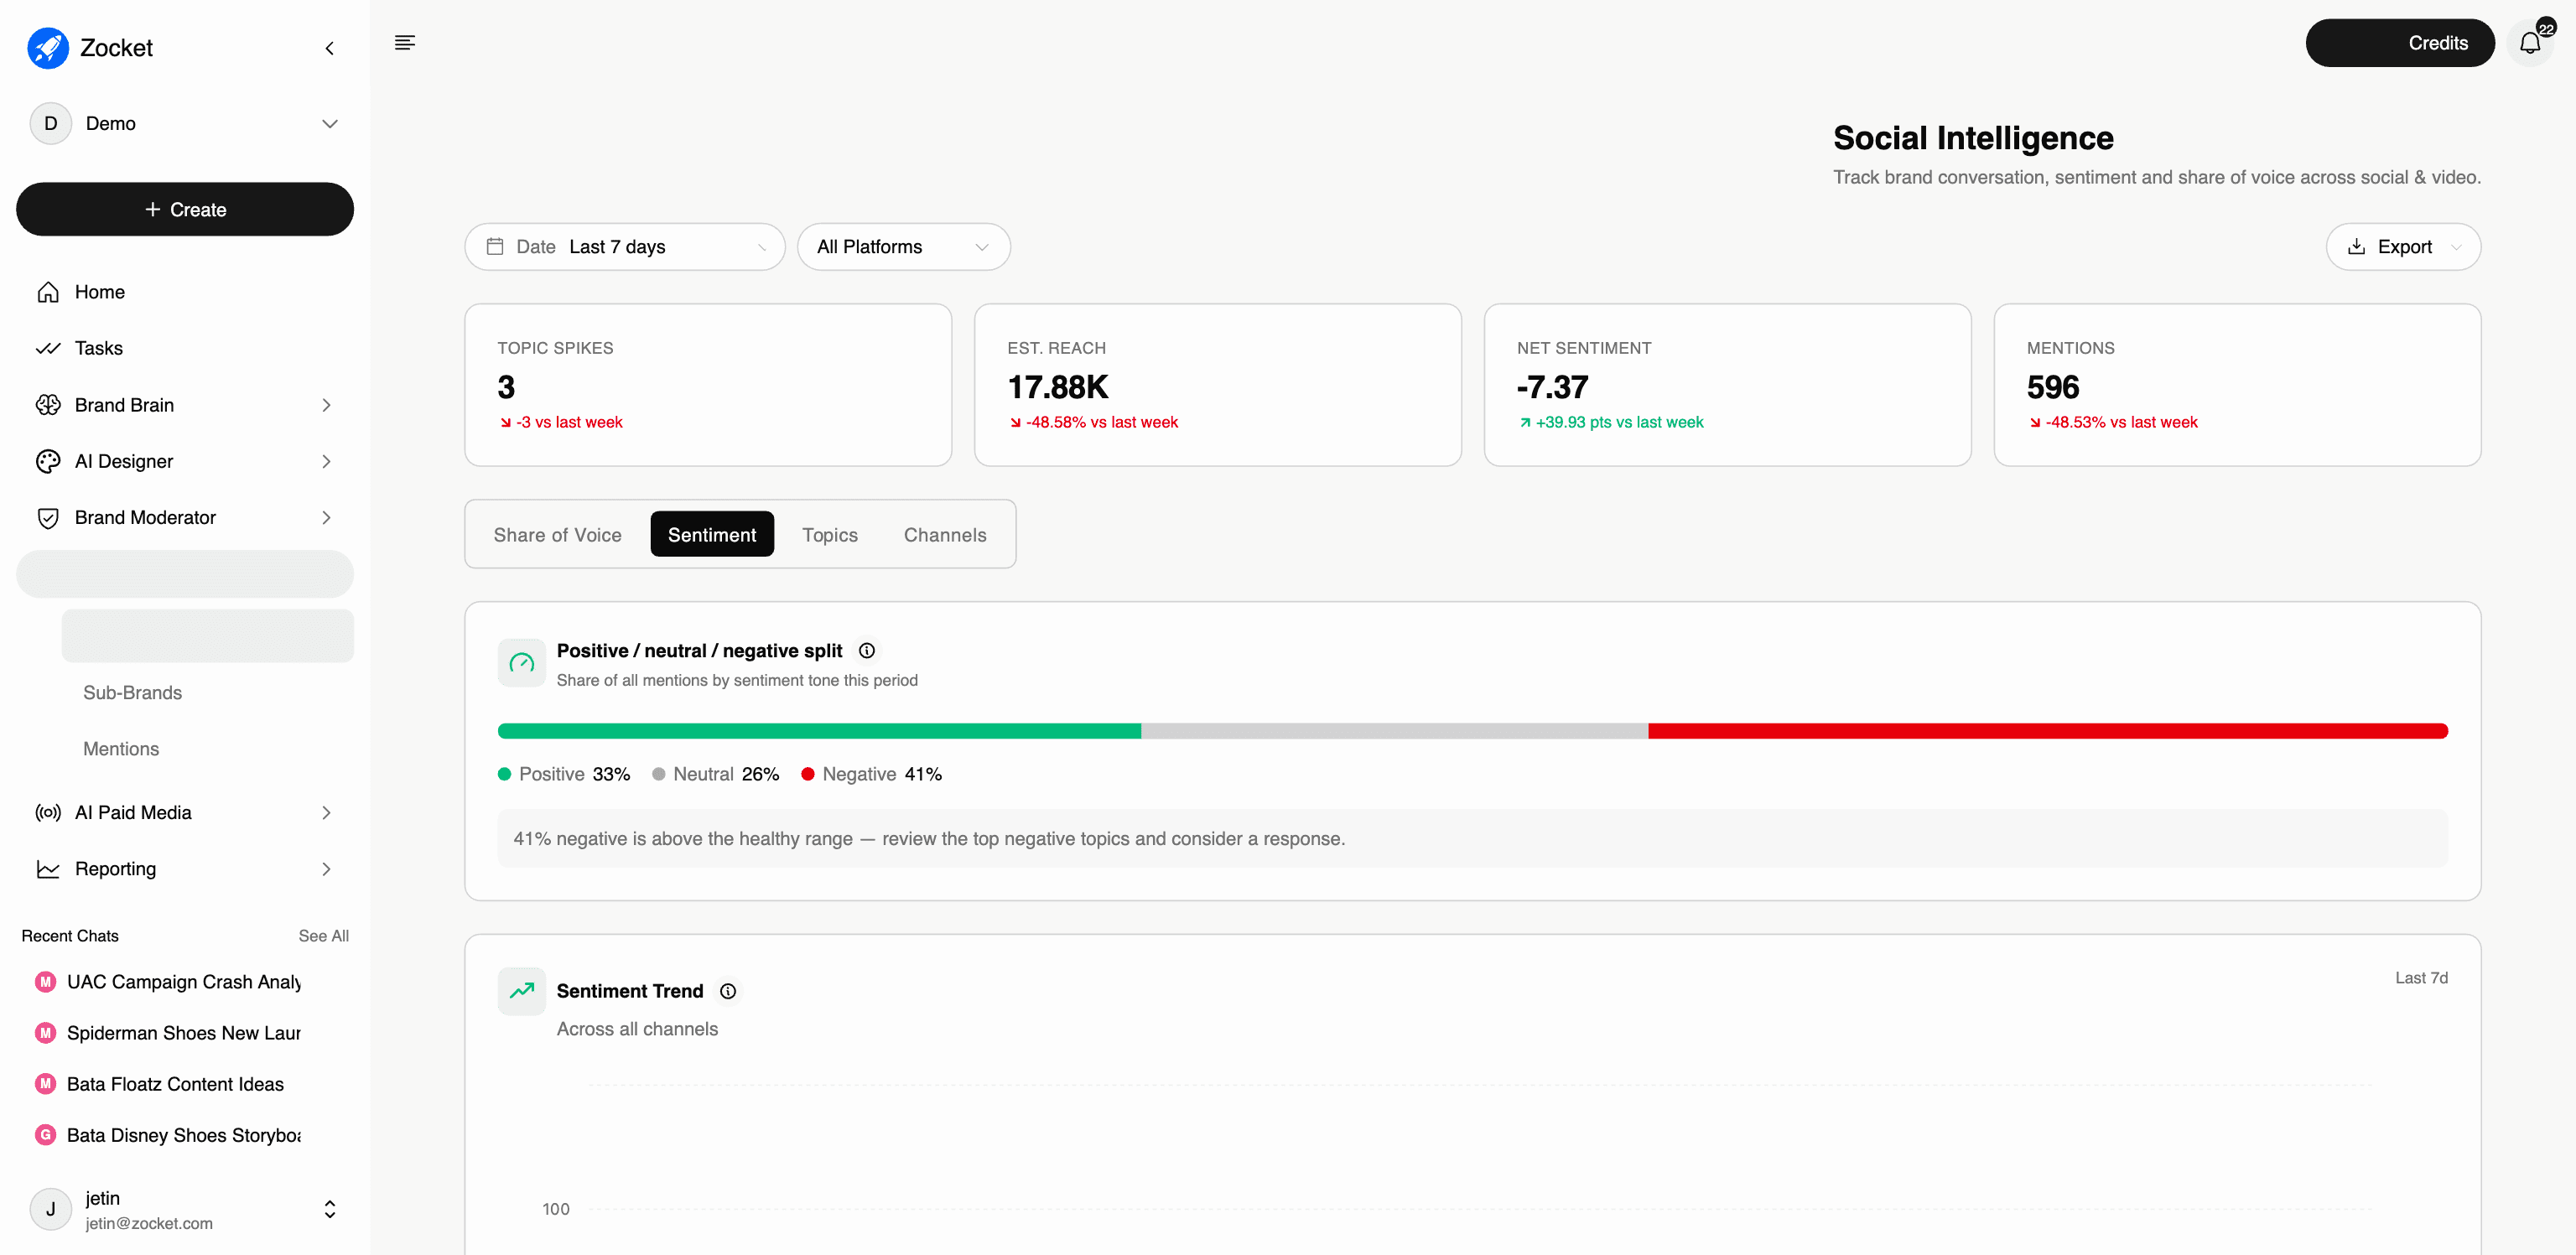
5Topics tab: spike analysis against an expected baseline, with each spike auto-explained (what drove it, how far above normal, mentions and reach) 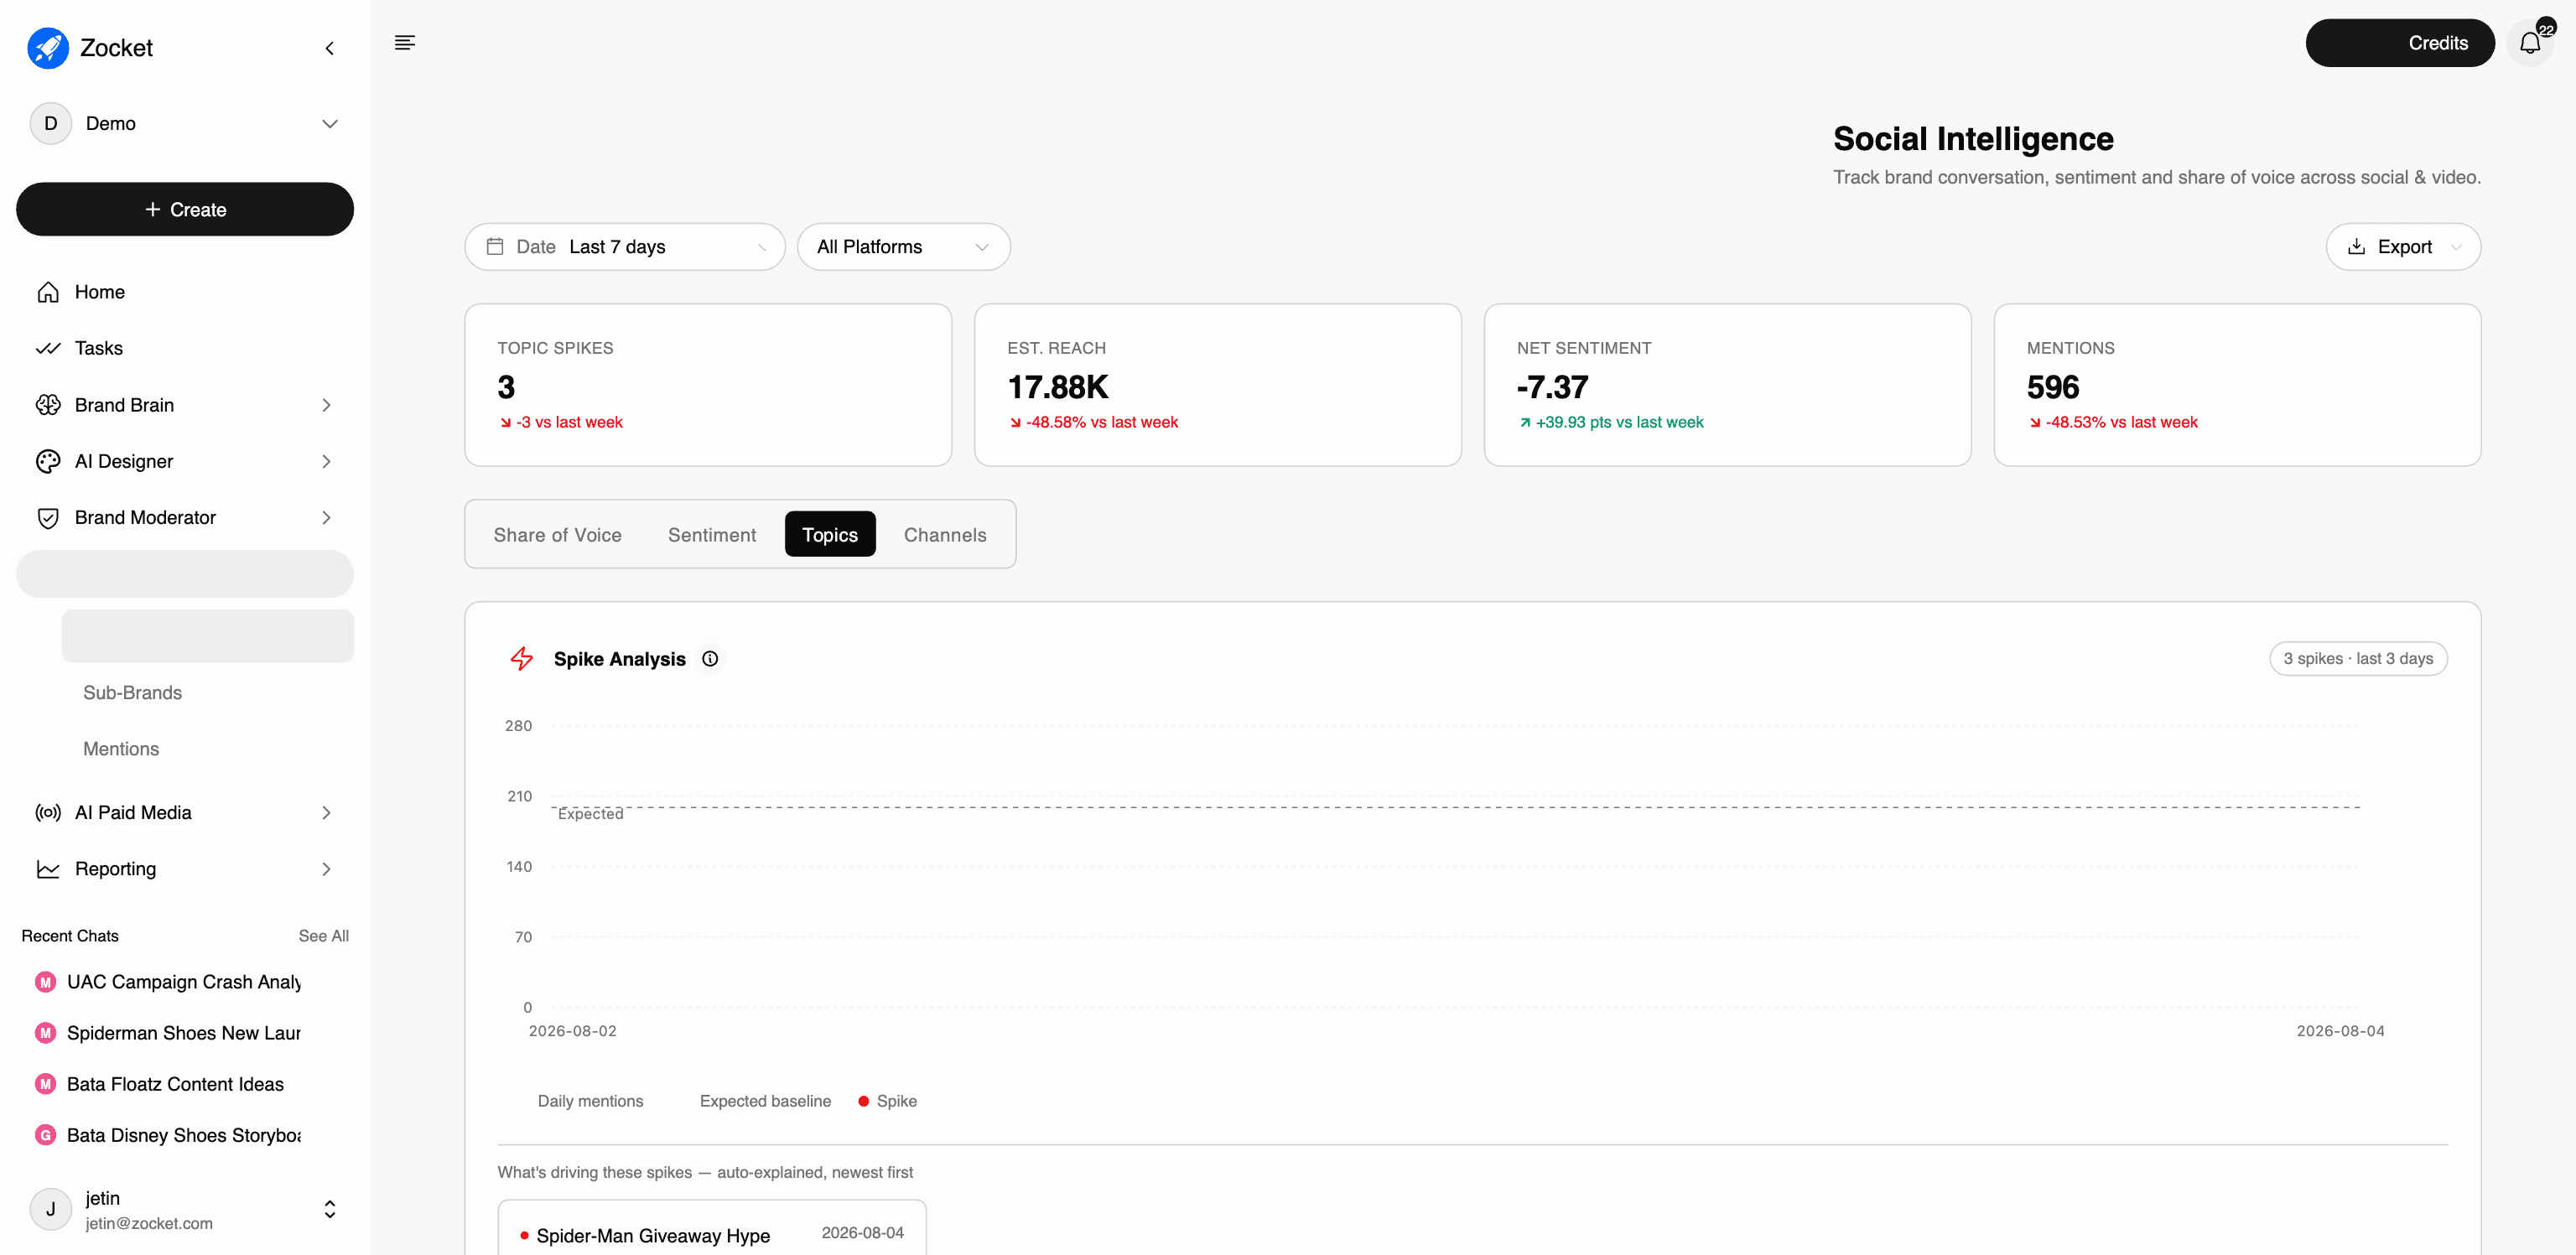
6Channels tab: mention growth per platform, the top themes people discuss on each one, competitor discussion themes, and a sentiment-coloured keyword cloud 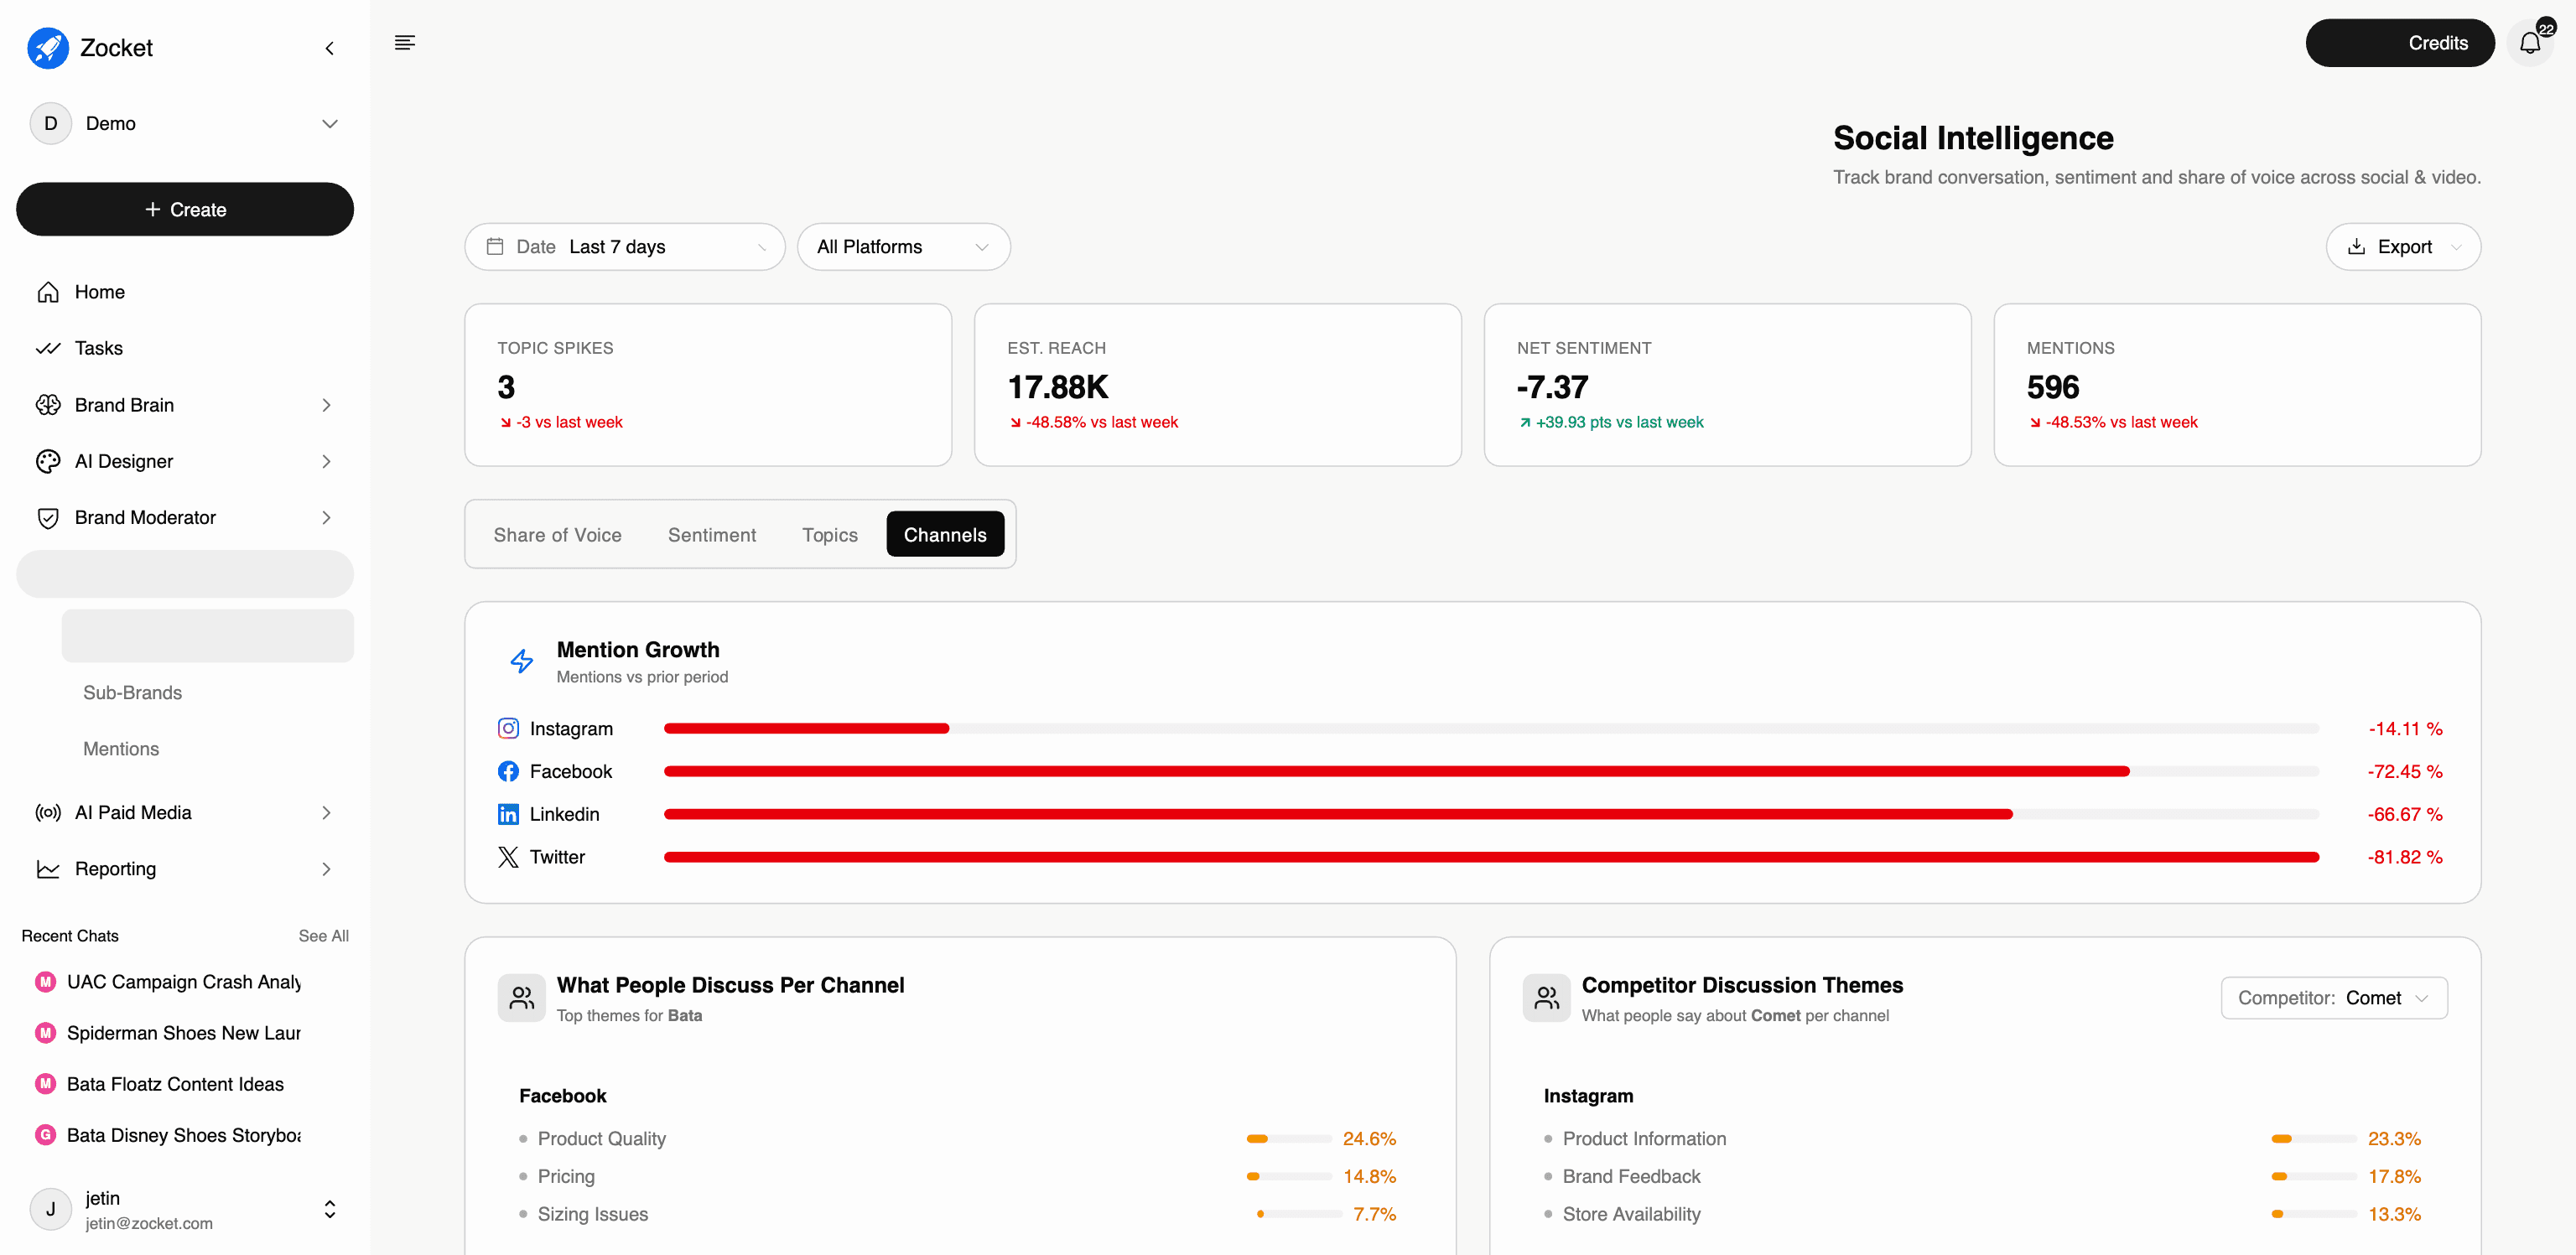
- MentionsThe raw stream underneath the charts, every tracked brand mention across channels and conversations, searchable by keyword and filterable by date. This is where you go to read the actual posts behind a sentiment dip, rather than trusting the aggregate.
- Sub-BrandsShows you how each sub-brand line is performing in customer perception. Useful when the master brand looks healthy but one sub-brand is silently dragging, a common pattern in multi-line consumer brands.